

The Ripple price closed below an important horizontal area, raising concerns that the XRP trend is bearish.
The downward movement is expected to continue unless the Ripple (XRP) price recovers above this area and launches a significant rally.
XRP has broken through long-term support
As the results of the technical analysis of the weekly chart show, the picture for the Ripple project token (XRP) looks bleak.
First, XRP has been declining since reaching a yearly high of $0.93 in July. At that point, the price bounced off the 0.382 Fibonacci retracement level (red icon). This resulted in a long upper wick, indicating that sellers have taken over and the trend is bearish.
Shortly thereafter, the price fell below the long-term horizontal area of $0.55. After XRP’s initial bullish breakout, it was expected that this level would become support. However, this did not happen and last week the price fell and closed below this area.
If the decline continues, the nearest support at $0.30 will be located 40% below the current price. On the other hand, a recovery above $0.55 could push the price up 85% to the yearly high of $0.93.
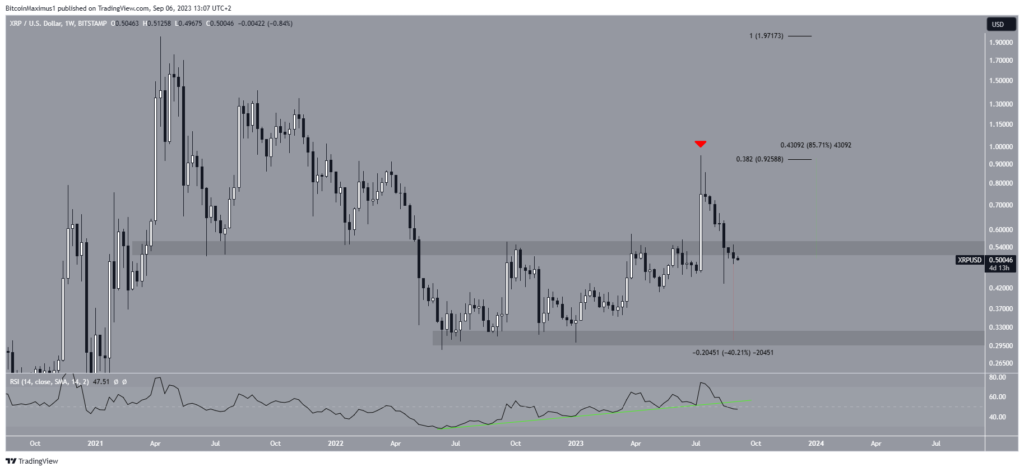
Finally, the weekly RSI started to show a bearish bias. This momentum indicator fell below the 50 mark and made a breakdown of the ascending support line (green color). These are signs of a bearish trend, which speaks in favor of further declines.
Can the bullish divergence condition a reversal
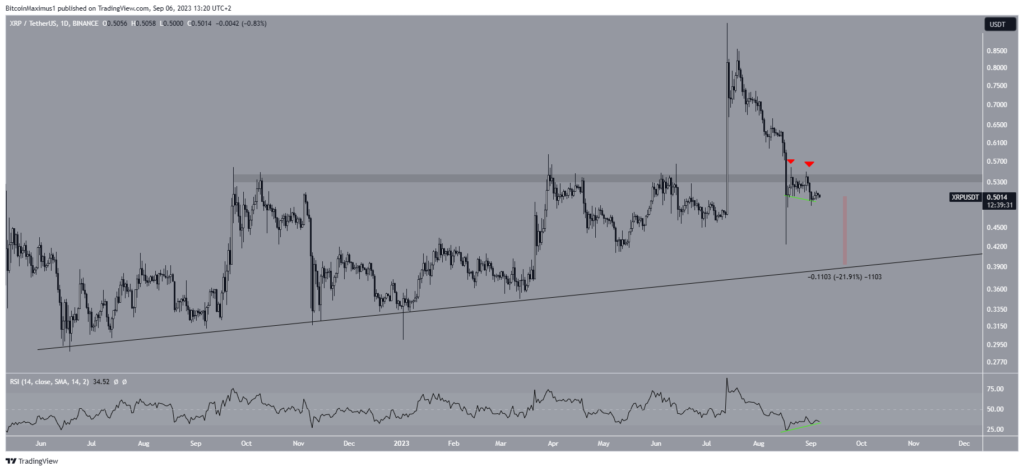
The readings of the daily timeframe coincide with the readings of the weekly chart. The main reason for this is the deviation of the price above the $0.54 area and the subsequent fall below it. Such deviations are considered signs of a bearish trend.
After falling below this area, XRP tested it twice as resistance (red icons) before resuming its decline.
If the price continues to fall, the nearest support will come into play at $0.40, which is 22% below the current price. This support is formed by an ascending line that has been present on the chart since June 2022. Such a venerable age suggests that the price could bounce once it reaches it.
In addition, the daily RSI is below the 50 mark and is declining. Both of these are considered to be signs of a bearish trend.
Meanwhile, the RSI indicator reflects a mixed picture. Although it is below 50, it is also showing strong bullish divergence signals. Such divergence often precedes bullish trend reversals. However, it remains to be seen whether this will be enough to negate all other bearish signs.
Thus, the most probable forecast is a fall of XRP to the nearest support at $0.40.
However, the price recovery above the $0.55 area will mean that the trend remains bullish. In this case, the coin may grow by 85% and head towards a new annual maximum.